Python Programming
Lecture 12 Downloading Data
12.1 Downloading Data (1)
- csv包 (教材使用): 主要用于逐行读取和写入 CSV 文件,更偏向基础文件处理。
- pandas: 能读取 CSV 文件,还提供筛选、统计、分组、缺失值处理,更适合完整的数据分析工作流。
import pandas as pd

df = pd.read_csv('sitka_weather_07-2021_simple.csv')
df.index
RangeIndex(start=0, stop=31, step=1)
df.columns
Index(['STATION', 'NAME', 'DATE', 'TAVG', 'TMAX', 'TMIN'], dtype='object')
df.head()
        STATION                 NAME          DATE  TAVG TMAX TMIN
0   USW00025333 SITKA AIRPORT, AK US    2021-07-01   NaN   61   53
1   USW00025333 SITKA AIRPORT, AK US    2021-07-02   NaN   60   52
2   USW00025333 SITKA AIRPORT, AK US    2021-07-03   NaN   66   54
3   USW00025333 SITKA AIRPORT, AK US    2021-07-04   NaN   60   55
4   USW00025333 SITKA AIRPORT, AK US    2021-07-05   NaN   65   55
Extracting and Reading Data
df["TMAX"]
0     61
1     60
...
29    73
30    66
Name: TMAX, dtype: int64
df.loc[0]
STATION             USW00025333
NAME       SITKA AIRPORT, AK US
DATE                 2021-07-01
TAVG                        NaN
TMAX                         61
TMIN                         53
Name: 0, dtype: object
df.loc[:,'TAVG':'TMAX']   #查看连续多列
df.loc[:,['TAVG','TMAX']] #查看特定多列
df.loc[2:4,:]   # 查看连续多行 不是左闭右开
df.loc[[2,4],:] # 查看特定多行
Modify Data
                        # calculation
                        df.loc[:, 'difference'] = df["TMAX"] - df["TMIN"]

                        # example
                        df.loc[:, 'x'] = 1
                        df.loc[:, 'y'] = range(31)
Delete Data
                        # 删除返回值
                        df_x = df.drop('difference', axis = 1) # 删除单列
                        df_y = df.drop(1, axis = 0)            # 删除单行
Filter Data
df_60 = df[df["TMAX"] >= 60]
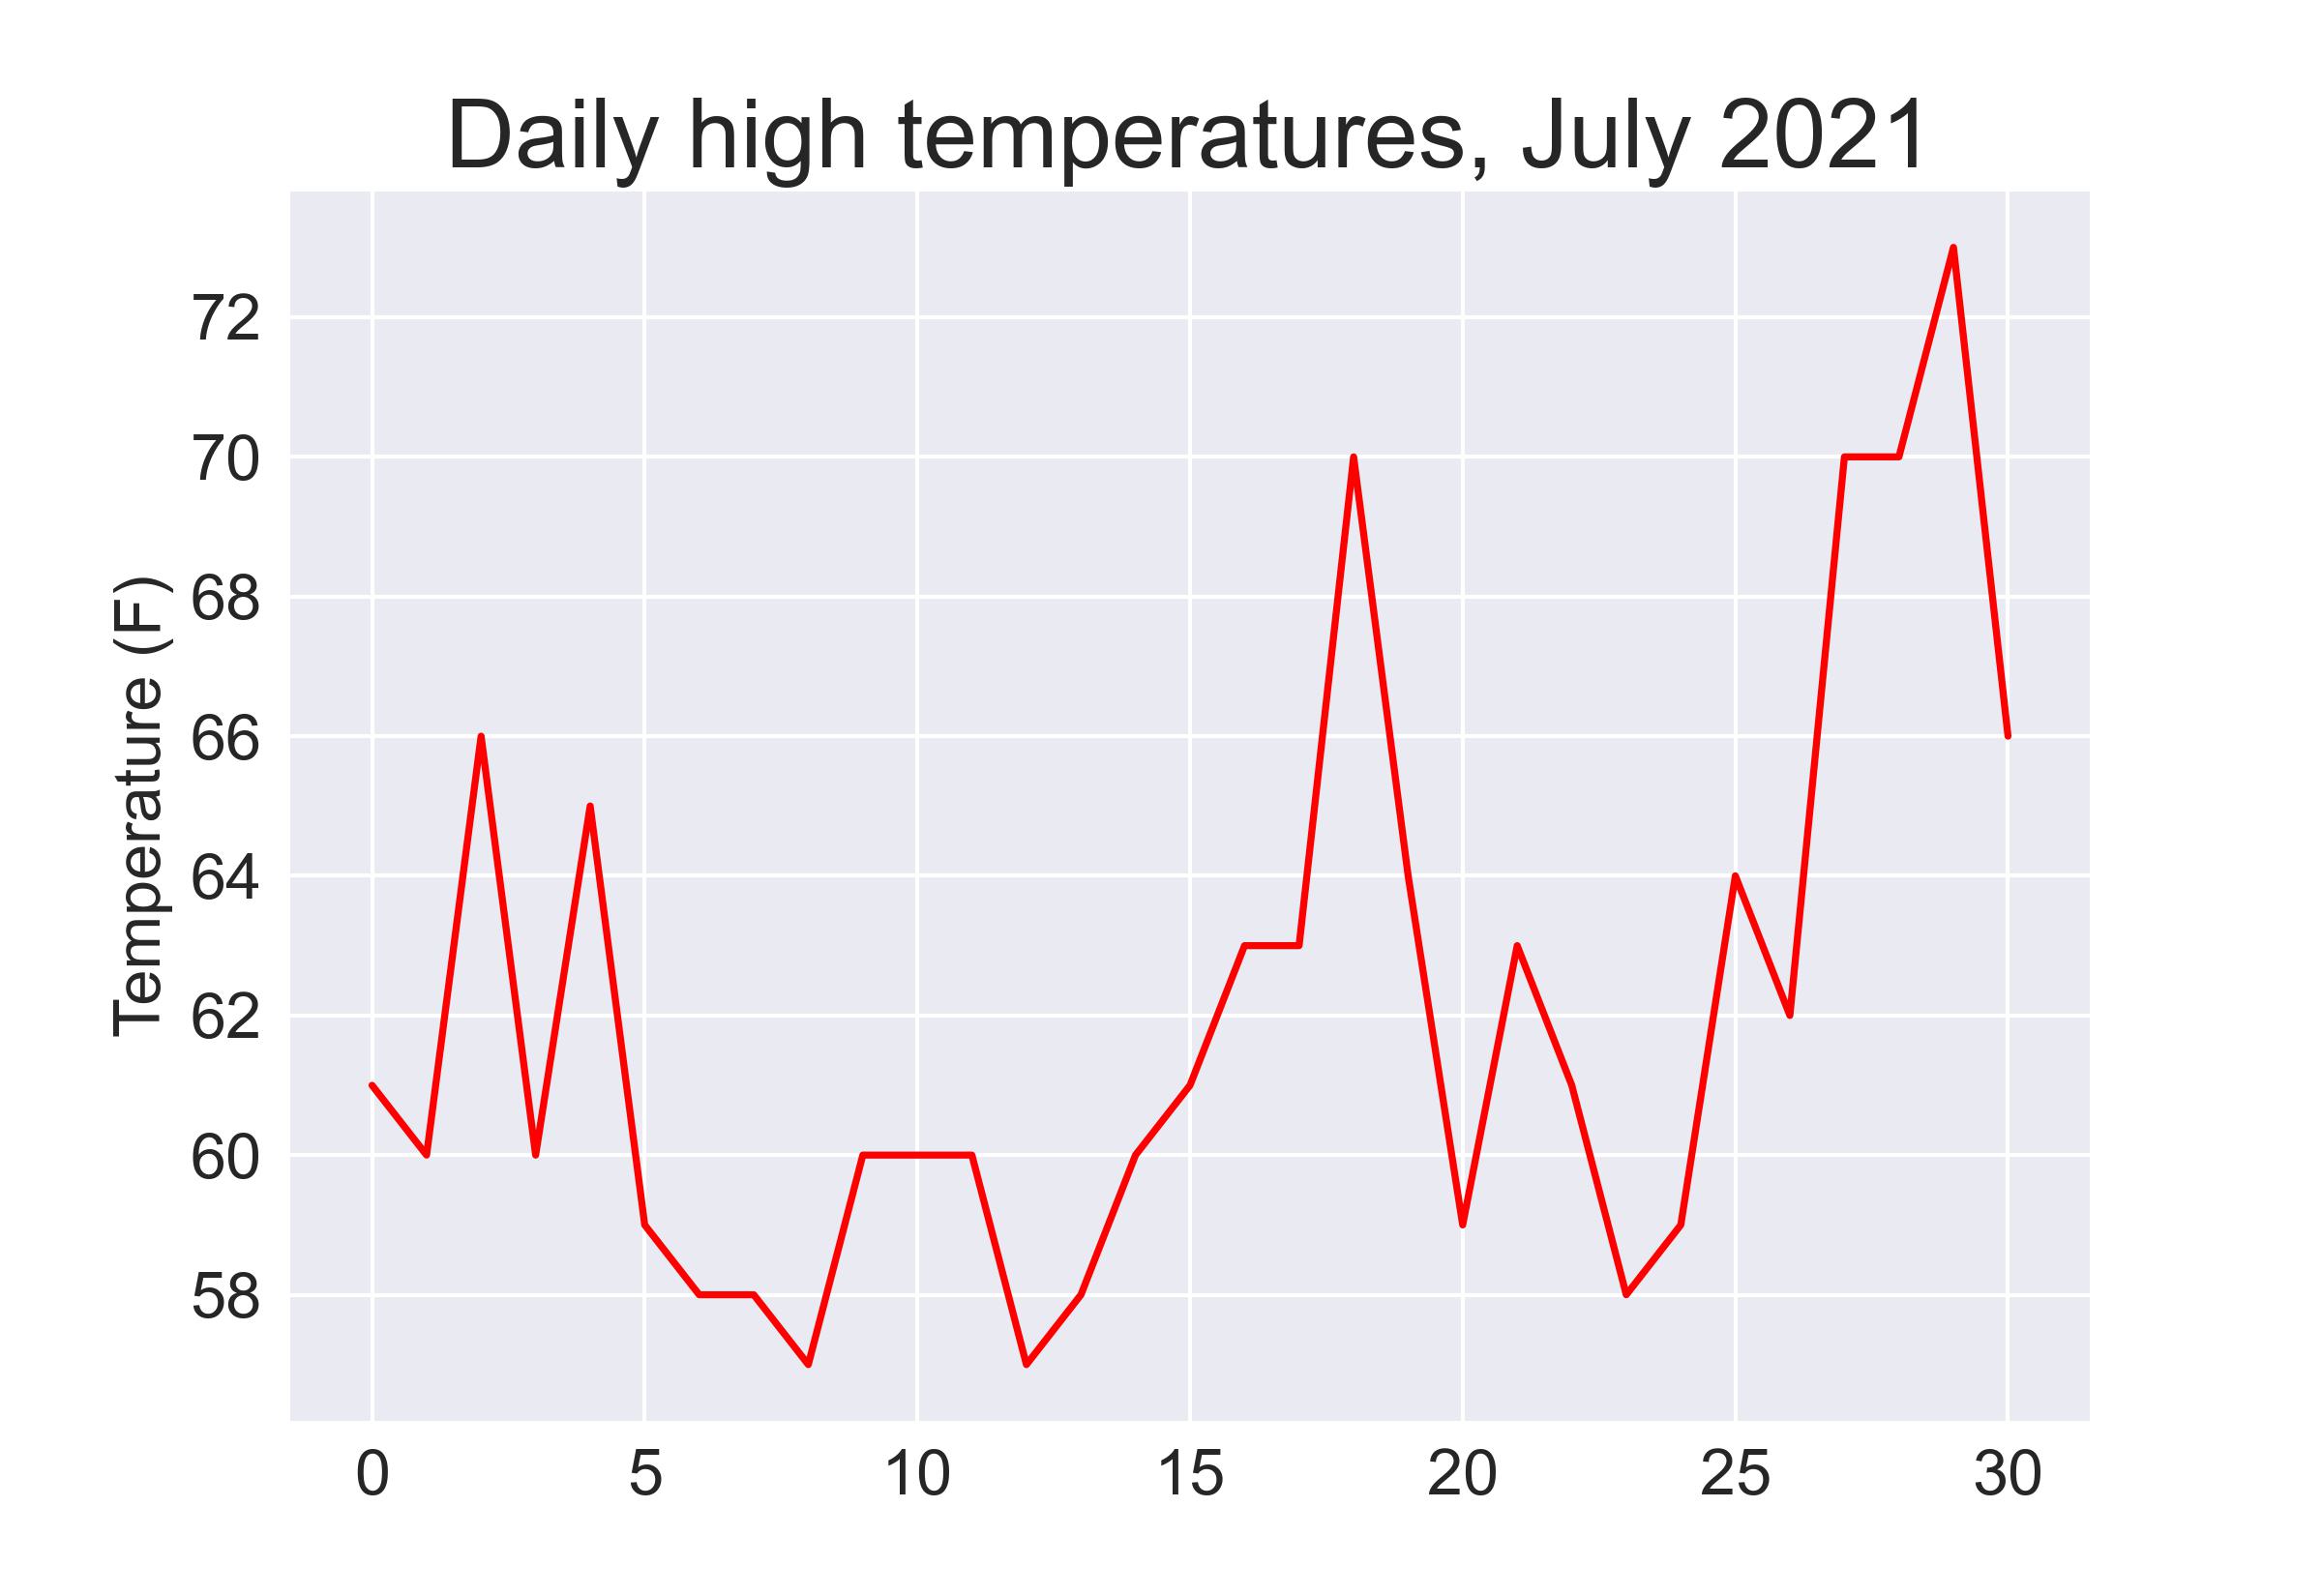
from matplotlib import pyplot as plt

# Plot the high temperatures.
fig, ax = plt.subplots()
ax.plot(df["TMAX"], c='red')

# Format plot.
ax.set_title("Daily high temperatures, July 2021", fontsize=24)
ax.set_xlabel('', fontsize=16)
ax.set_ylabel("Temperature (F)", fontsize=16)
ax.tick_params(labelsize=16)

plt.savefig('simple.jpg',bbox_inches='tight',dpi=300)
datetime
# convert string to time format
df.loc[:,'date'] = pd.to_datetime(df['DATE'])
first_date = pd.to_datetime('2021-7-1',format = '%Y-%m-%d')
%A Weekday name, such as Monday; %B Month name, such as January;
%m Month, as a number (01 to 12)
%d Day of the month, as a number (01 to 31)
%Y Four-digit year, such as 2015; %y Two-digit year, such as 15
%M Minutes (00 to 59); %S Seconds (00 to 61)
# filtering data by date
df_t = df[(df['date']>="20210715") & (df['date']<="20210720")]
df_t
14  USW00025333 SITKA AIRPORT, AK US    2021-07-15  NaN 60  50  2021-07-15
...
19  USW00025333 SITKA AIRPORT, AK US    2021-07-20  NaN 64  56  2021-07-20
# calculate periods
periods = df.loc[20, "date"] - df.loc[1, "date"]
periods.days
19
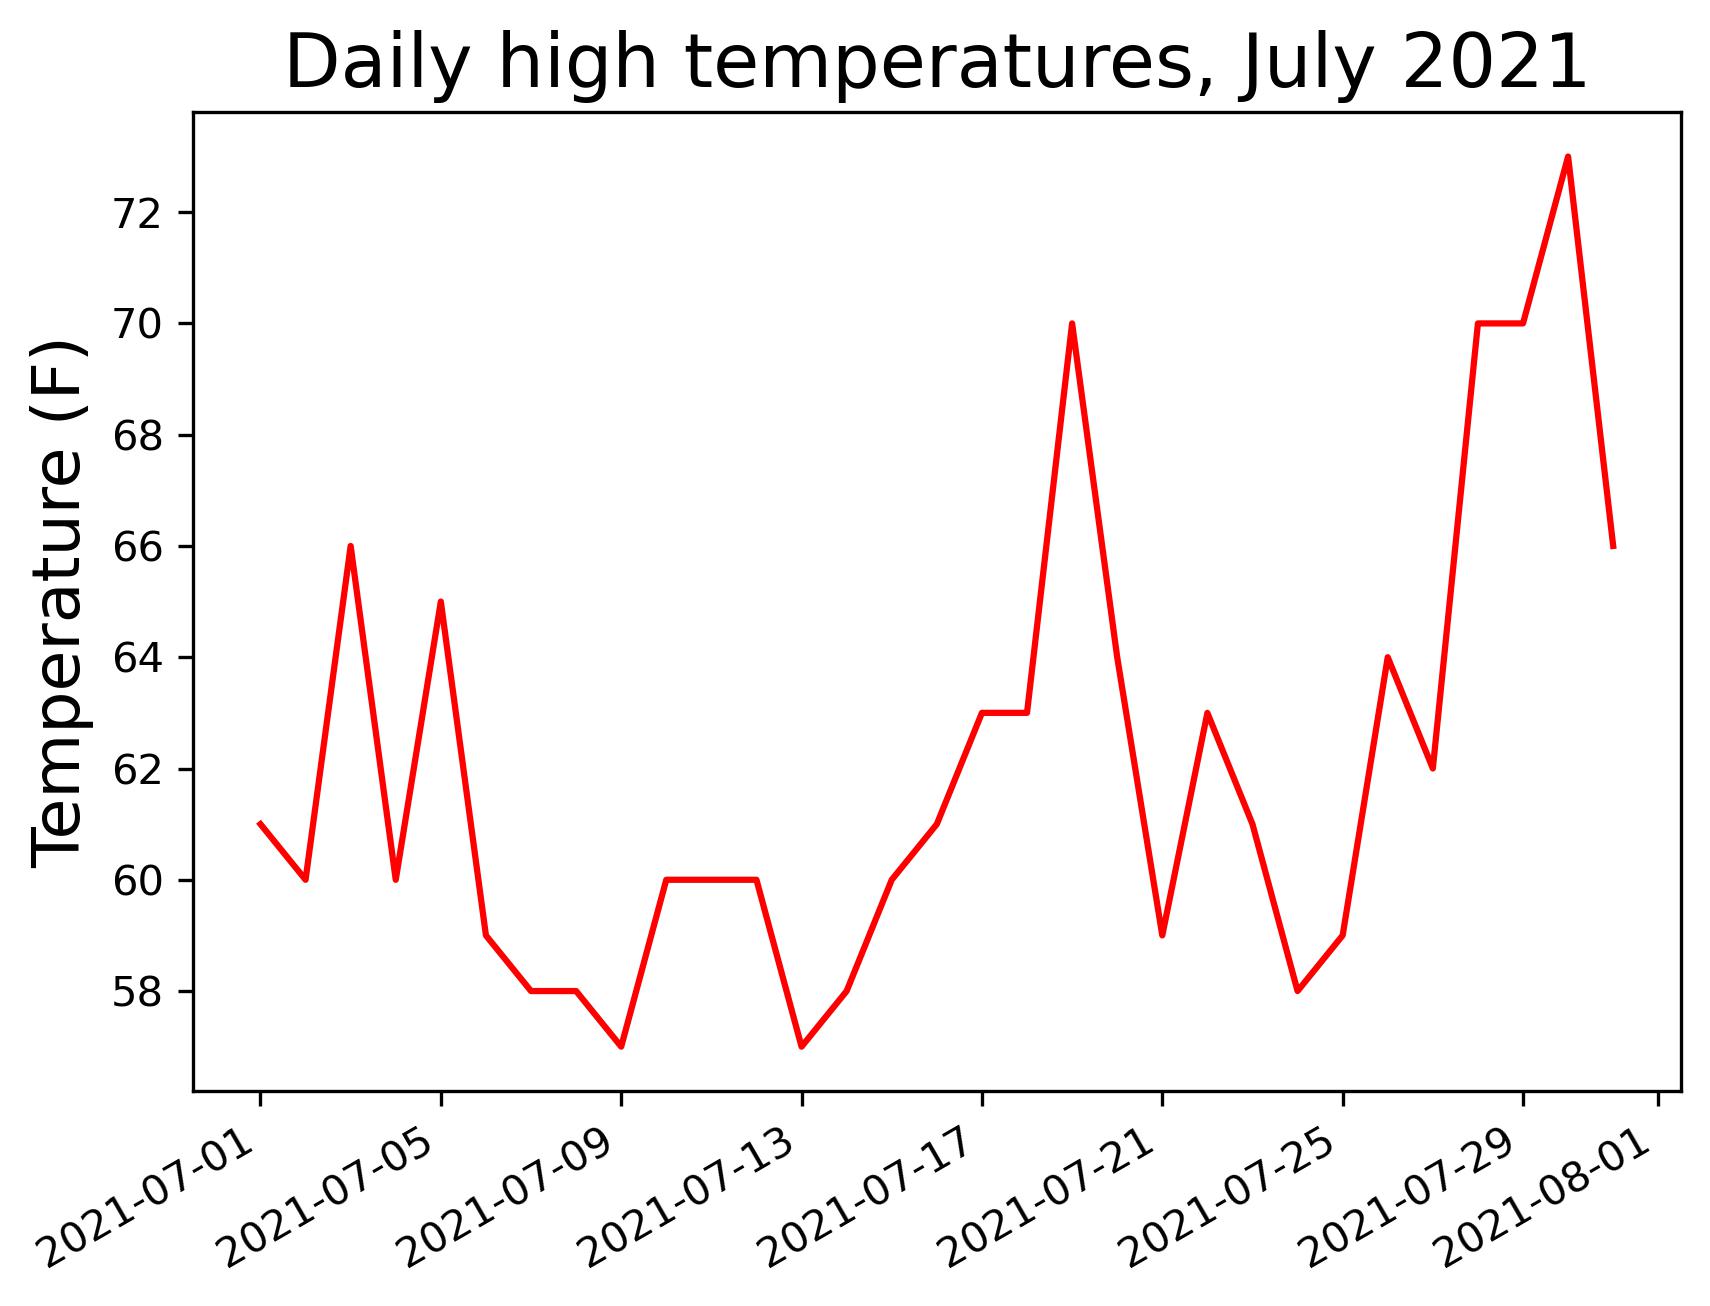
df.loc[:,'date'] = pd.to_datetime(df['DATE'])

fig, ax = plt.subplots()
ax.plot(df["date"], df["TMAX"], c='red')

ax.set_title("Daily high temperatures, July 2021", fontsize=18)
ax.set_xlabel('', fontsize=16)
fig.autofmt_xdate()
ax.set_ylabel("Temperature (F)", fontsize=16)
ax.tick_params(labelsize=10)

plt.savefig('simple.jpg',bbox_inches='tight',dpi=300)
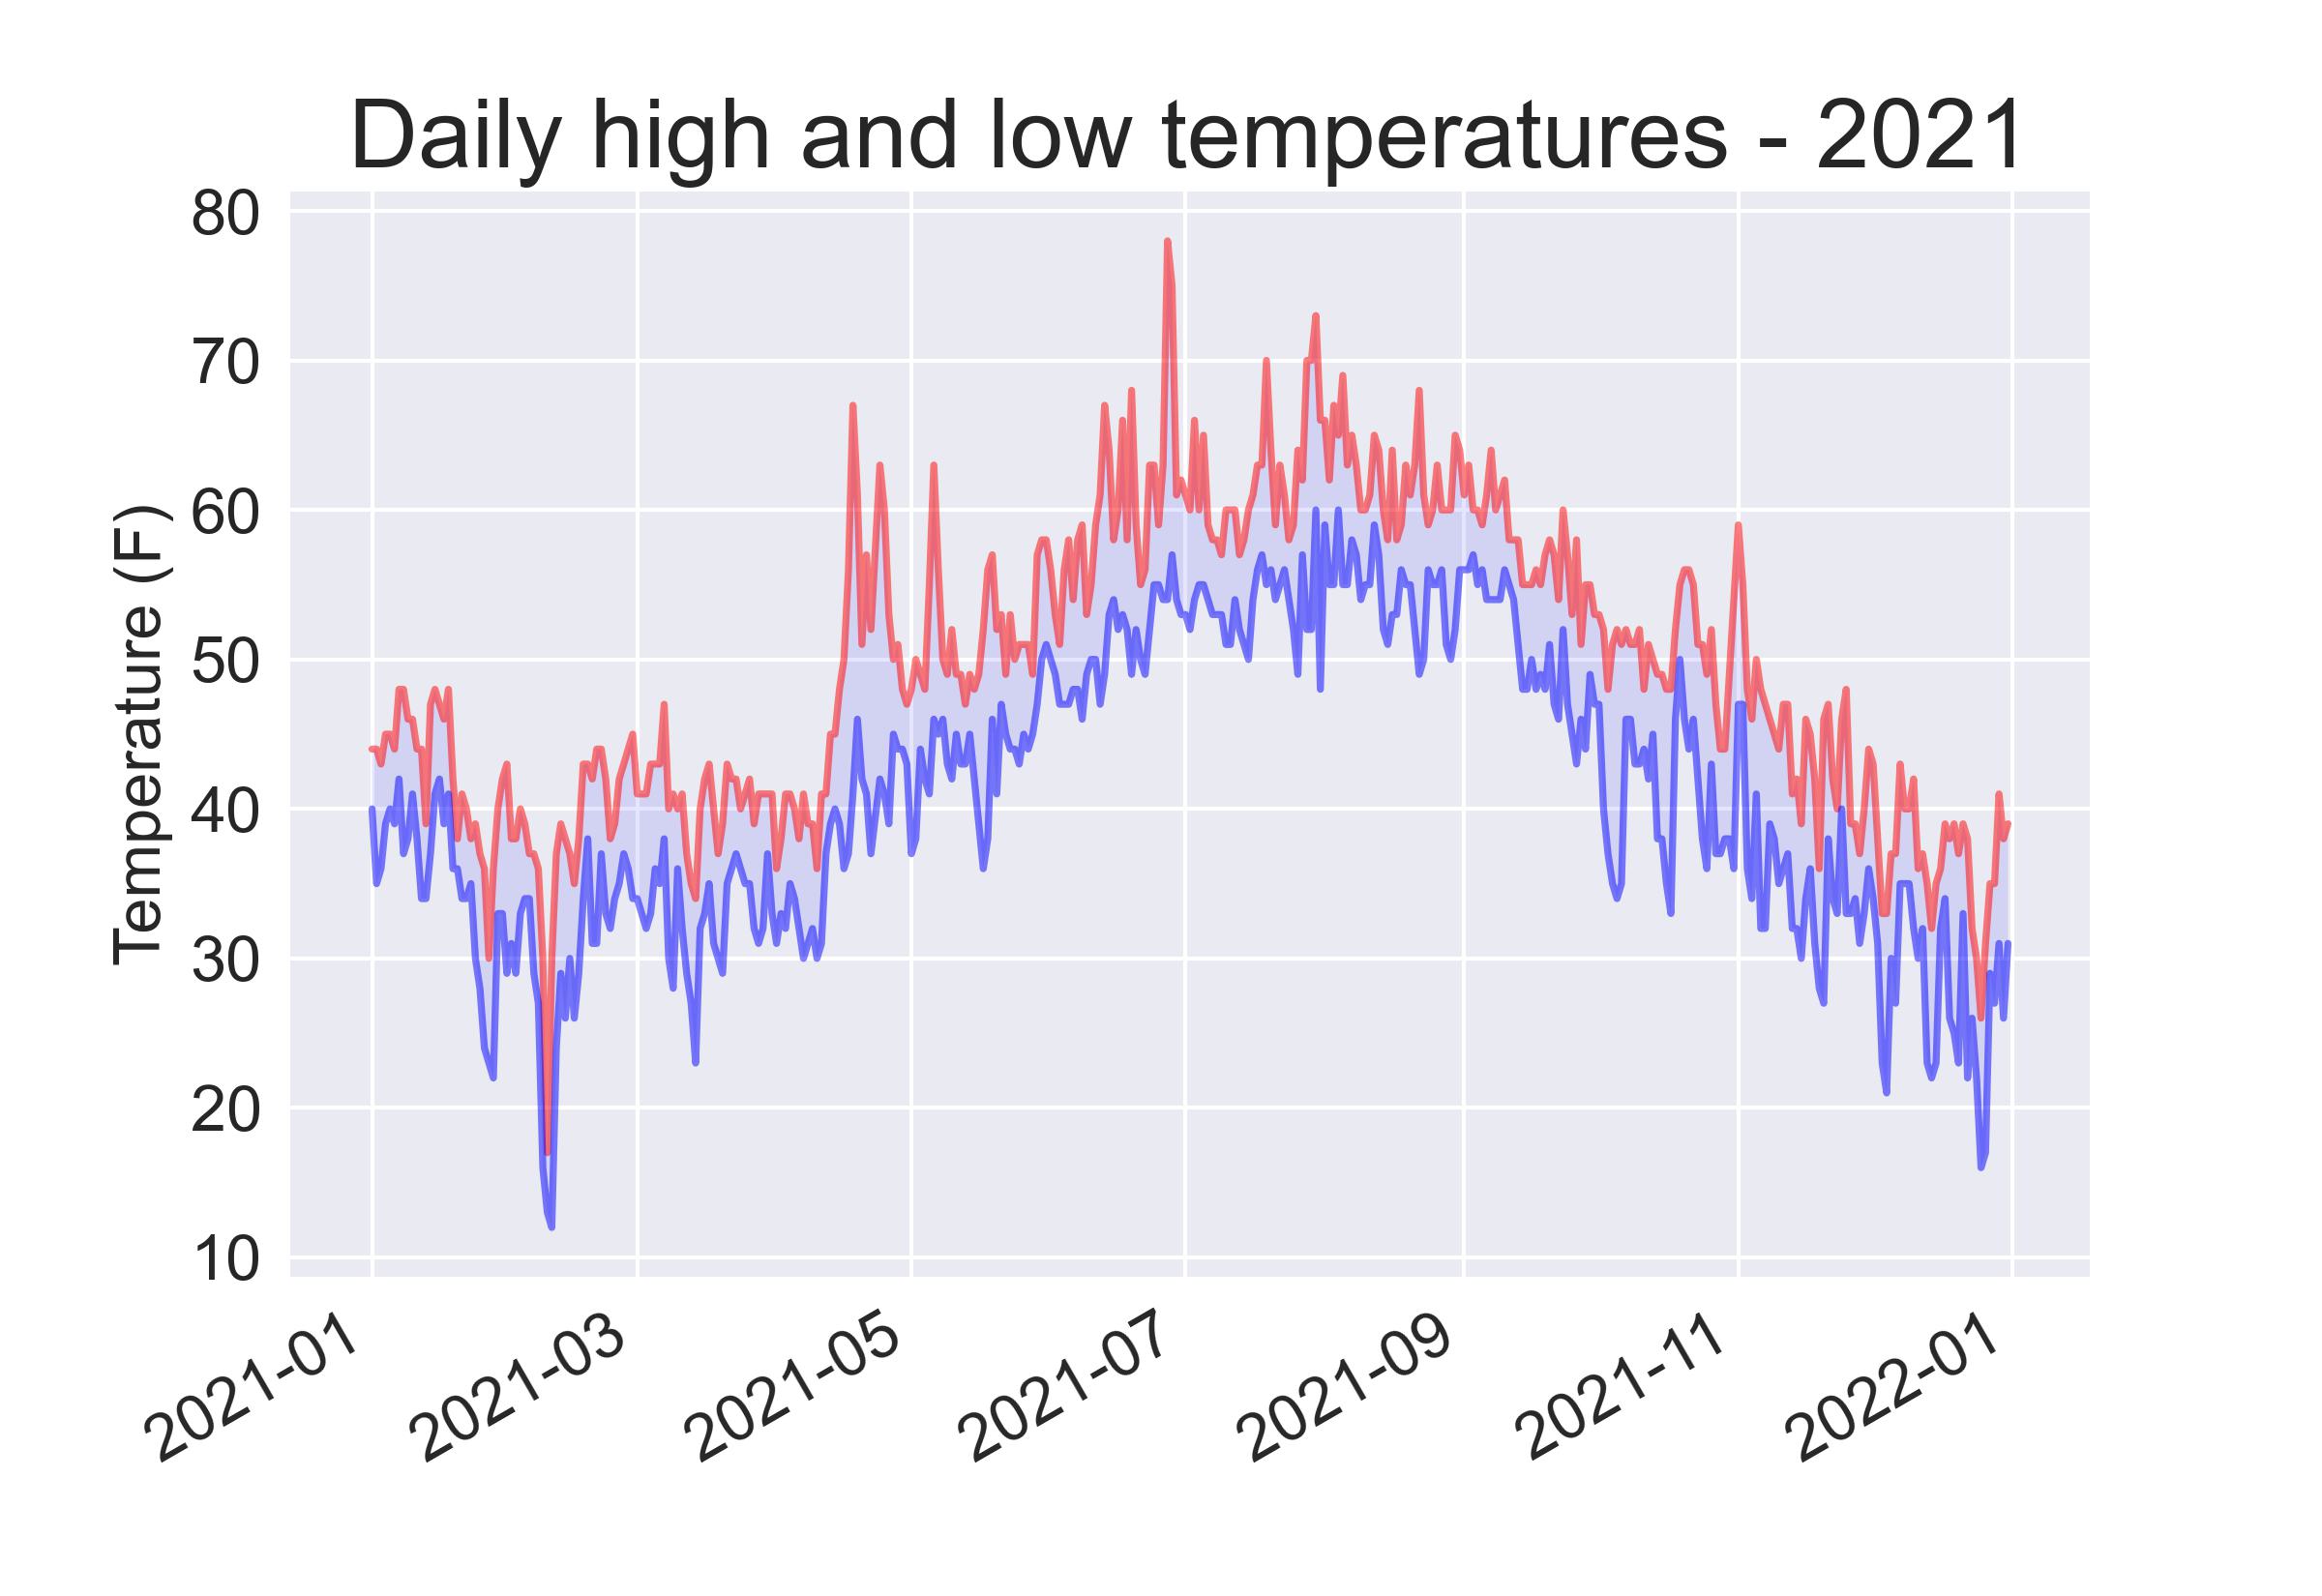
import pandas as pd

df = pd.read_csv('sitka_weather_2021_simple.csv')
df.loc[:,'date'] = pd.to_datetime(df['DATE'])

# Plot data.
fig, ax = plt.subplots()
ax.plot(df["date"], df["TMAX"], c='red', alpha=0.5)
ax.plot(df["date"], df["TMIN"], c='blue', alpha=0.5)
ax.fill_between(df["date"], df["TMAX"], df["TMIN"], facecolor='blue', alpha=0.1)

# Format plot.
ax.set_title("Daily high and low temperatures - 2021", fontsize=18)
ax.set_xlabel('', fontsize=16)
fig.autofmt_xdate()
ax.set_ylabel("Temperature (F)", fontsize=16)
ax.tick_params(labelsize=10)

plt.savefig('simple.jpg',bbox_inches='tight',dpi=300)
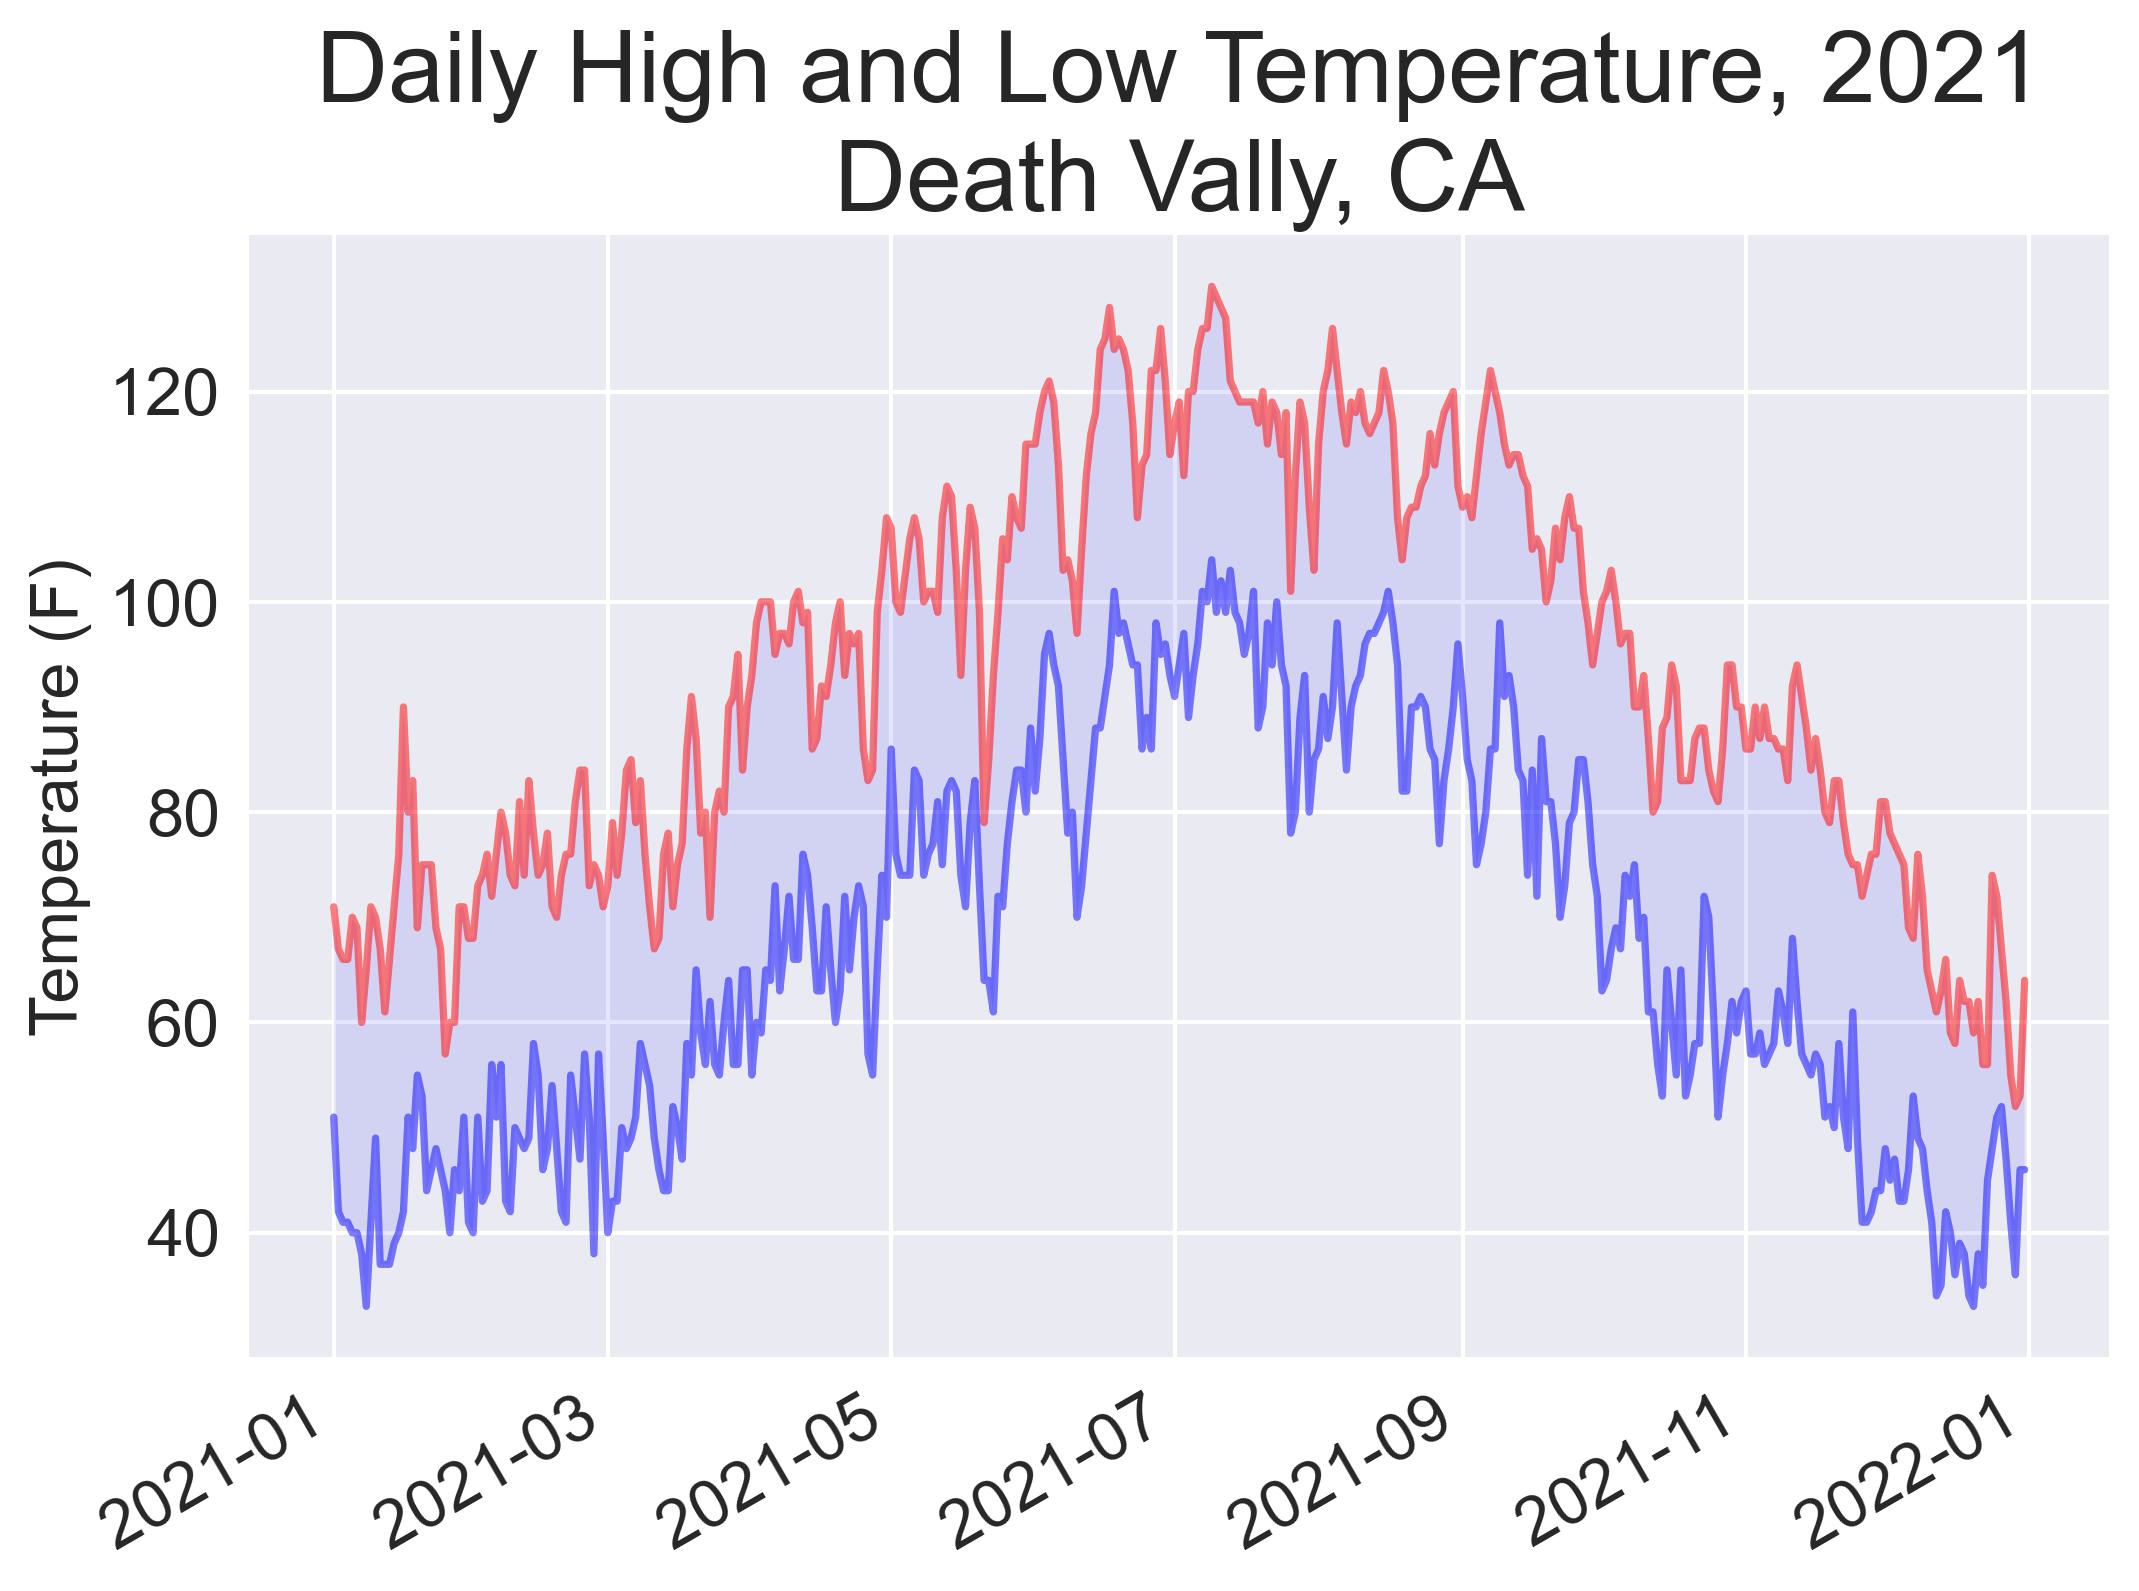
Handling Missing Data
import pandas as pd
from matplotlib import pyplot as plt

frame = pd.read_csv('death_valley_2021_simple.csv')
frame.info()
RangeIndex: 365 entries, 0 to 364
Data columns (total 6 columns):
 #   Column   Non-Null Count  Dtype
---  ------   --------------  -----
 0   STATION  365 non-null    object
 1   NAME     365 non-null    object
 2   DATE     365 non-null    object
 3   TMAX     364 non-null    float64
 4   TMIN     365 non-null    int64
 5   TOBS     360 non-null    float64
dtypes: float64(2), int64(1), object(3)
memory usage: 17.2+ KB
frame[frame["TMAX"].isna()]
123 USC00042319 DEATH VALLEY NATIONAL PARK, CA US 2021-05-04 NaN 72 89.0
frame_DT = frame[["DATE", "TMAX", "TMIN"]]
frame_cleaned = frame_DT.dropna()
frame_cleaned.info()
Index: 364 entries, 0 to 364
Data columns (total 3 columns):
 #   Column  Non-Null Count  Dtype
---  ------  --------------  -----
 0   DATE    364 non-null    object
 1   TMAX    364 non-null    float64
 2   TMIN    364 non-null    int64
dtypes: float64(1), int64(1), object(1)
memory usage: 11.4+ KB
12.2 Downloading Data (2)
.JSON
from pathlib import Path
import pandas as pd
import json

path = Path('btc_close_2017.json')
contents = path.read_text()
btc_data = json.loads(contents)

date = [];close=[]; months=[]
for btc_dict in btc_data:
    months.append(int(btc_dict['month']))
    close.append(float(btc_dict['close']))
    date.append(btc_dict['date'])

df = pd.DataFrame({"close": close, "months": months, "date": date})
df.loc[:,'date'] = pd.to_datetime(df['date'], format = '%Y-%m-%d')
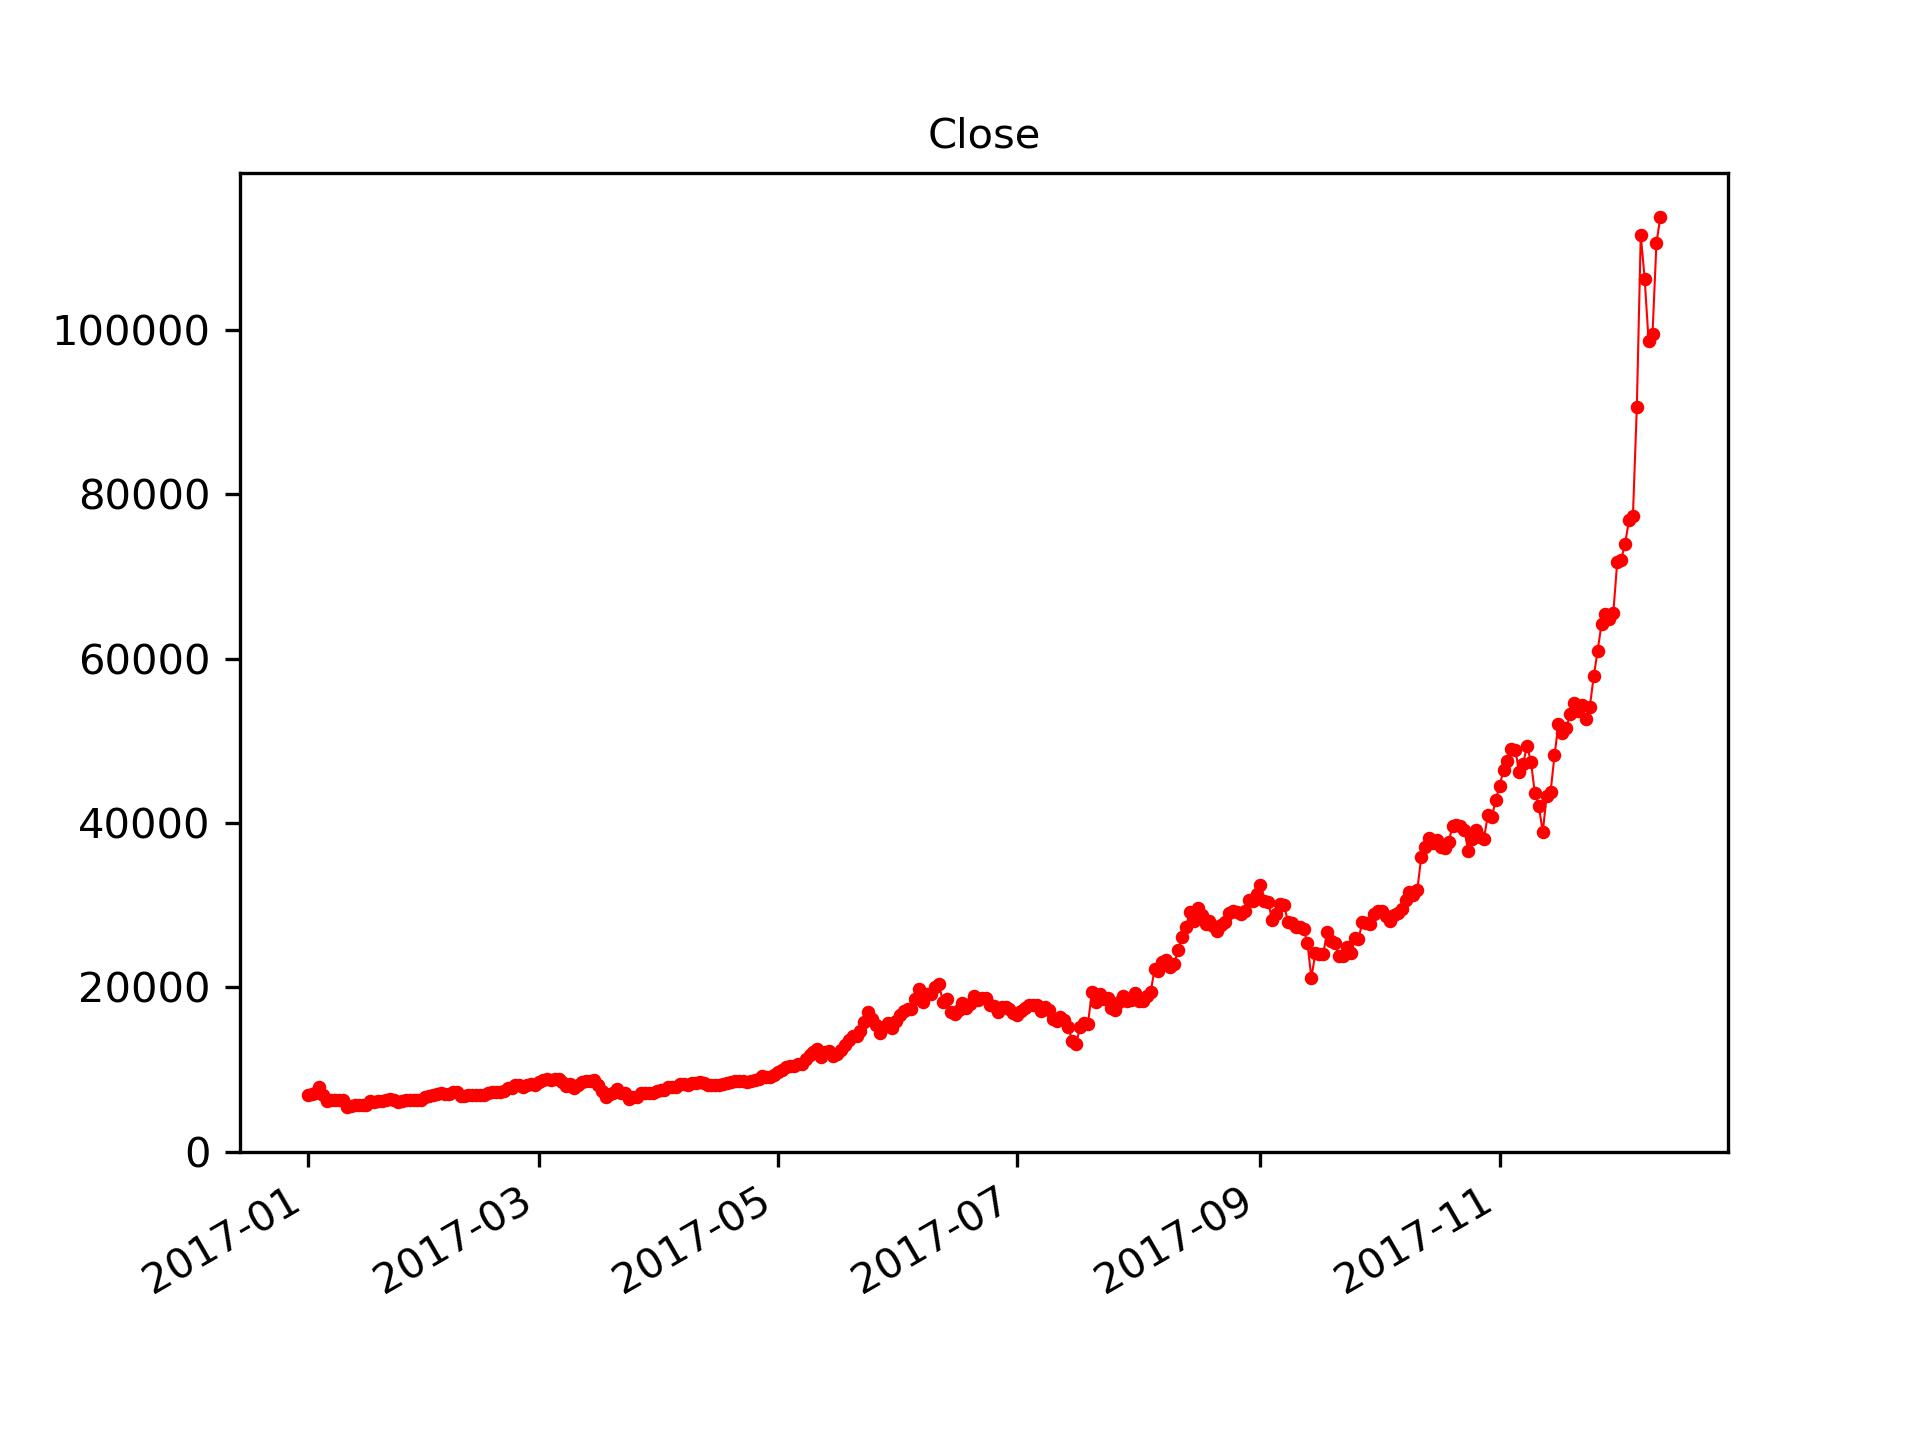
import matplotlib.pyplot as plt

fig, ax = plt.subplots()

ax.plot(df['date'],df['close'], linewidth=0.5, c='red')
ax.scatter(df['date'],df['close'], s=5, c='red')
ax.set_title('Close',fontsize=10)
fig.autofmt_xdate()

plt.savefig('close.jpg',dpi=300)
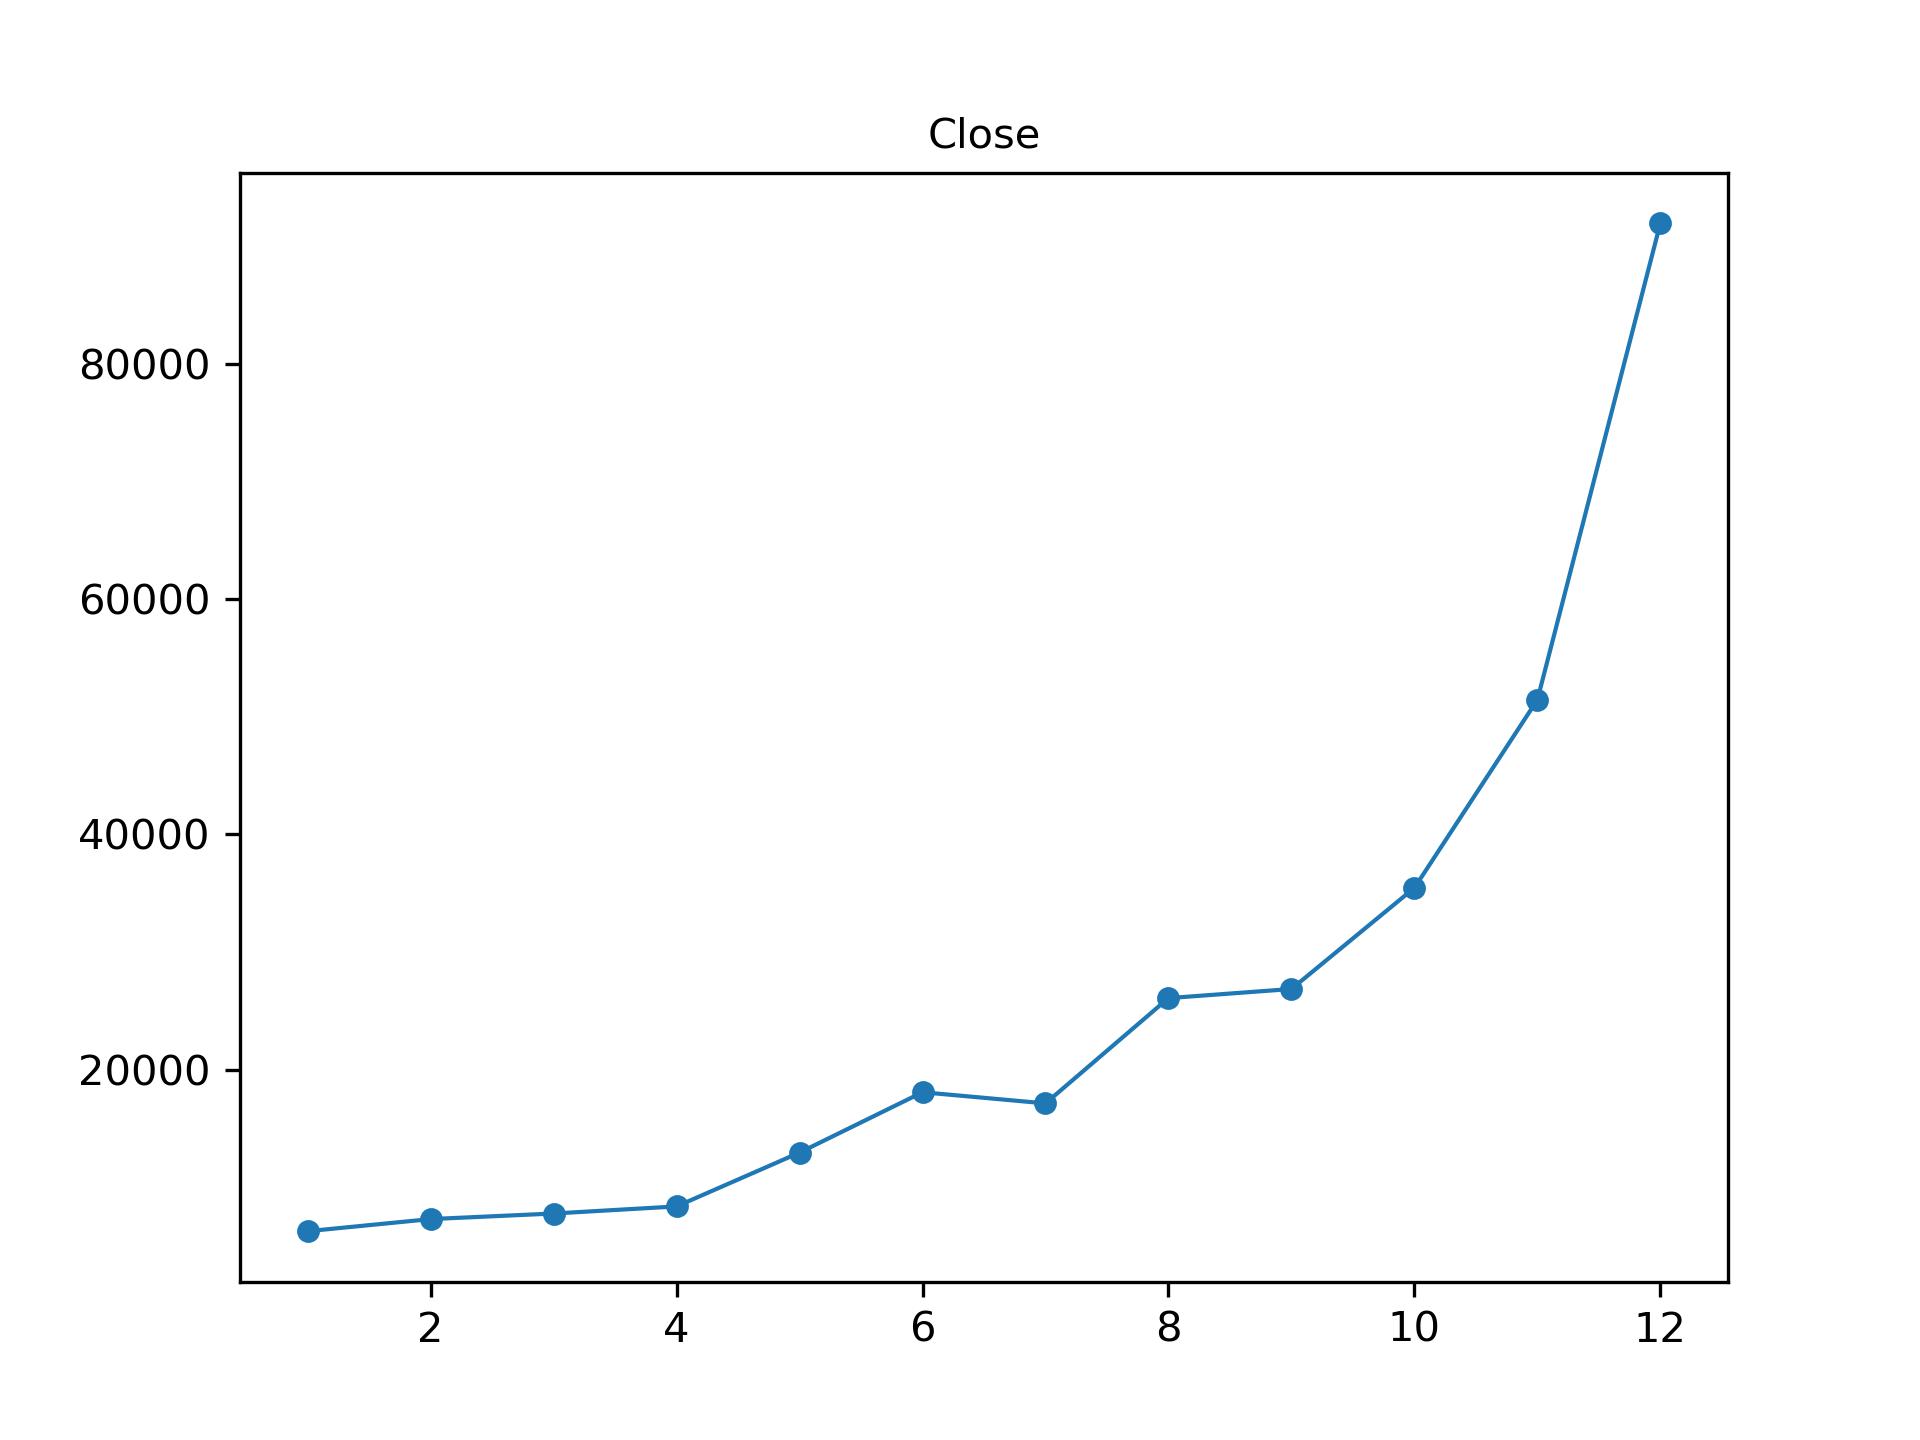
monthly_avg = df.groupby('months')['close'].mean()
# mean(), sum(), max(), min(), std()
def f(arr):
    return arr.max()-arr.min()
monthly_avg = df.groupby('months')['close'].apply(f)
monthly_avg = df.groupby('months')['close'].mean()
monthly_avg
months
1      6285.870968
2      7315.714286
...
11    51436.166667
12    91936.416667
Name: close, dtype: float64
import matplotlib.pyplot as plt

fig, ax = plt.subplots()

ax.plot(monthly_avg.index, monthly_avg.values, linewidth=1)
ax.scatter(monthly_avg.index, monthly_avg.values, s=20)
ax.set_title('Close',fontsize=10)

plt.savefig('monthly_avg.jpg',dpi=300)
Exercise: 人口数据可视化
- 现在有3个JSON文件,分别统计了中国,印度和美国1960-2024年的人口数量,点击下载数据
- 绘制一幅折线图,描述任一个国家的人口走势,你可以参考刚刚学过的代码
from pathlib import Path
import pandas as pd
import json
path = Path('btc_close_2017.json')
contents = path.read_text()
btc_data = json.loads(contents)
date = [];close=[]; months=[]
for btc_dict in btc_data:
    months.append(int(btc_dict['month']))
    close.append(float(btc_dict['close']))
    date.append(btc_dict['date'])
df = pd.DataFrame({"close": close, "months": months, "date": date})
df.loc[:,'date'] = pd.to_datetime(df['date'], format = '%Y-%m-%d')
import matplotlib.pyplot as plt

fig, ax = plt.subplots()
ax.plot(df['date'],df['close'], linewidth=0.5, c='red')
fig.autofmt_xdate()

plt.savefig('close.jpg',dpi=300)
Data Combine
df_C
    date           pop
0   2024    1408975000
1   2023    1410710000
... ... ...
63  1961    660330000
64  1960    667070000
df_I
    date           pop
0   2024    1408975000
1   2023    1410710000
... ... ...
63  1961    446564729
64  1960    435990338
df_wide=pd.merge(df_C,df_I,on='date',\
                suffixes=["_C","_I"])
df_wide
    date         pop_C       pop_I
0   2024    1408975000  1450935791
... ... ... ...
63  1961    660330000   446564729
64  1960    667070000   435990338
df_long = pd.concat([df_C, df_I], \
                    ignore_index=True)
df_long
    date    pop
0   2024    1408975000
... ... ...
128 1961    446564729
129 1960    435990338
Summary
- Downloading Data
- Reading: Python Crash Course, Chapter 16